
Monitoring
Health checks, Prometheus metrics, Grafana, and operational monitoring guidance.
FireSonic exposes several layers of operational visibility: the health endpoint for current runtime state, Prometheus metrics for time-series collection, and the official Grafana dashboard for visual monitoring and capacity analysis.
Health endpoint
The health endpoint exposes the current application, database, listener, processing, script, rule, and operational state. It is suitable for liveness checks, operational diagnostics, and integration with infrastructure monitoring.
http://localhost:8181/healthPrometheus metrics Commercial
The Prometheus /metrics endpoint provides time-series metrics for the message pipeline and runtime. Typical measurements include intake and processing rates, ACK/NAK activity, FHIR delivery behavior, failures, latency, storage growth, database state, backup state, JVM/runtime metrics, and operational health.
http://localhost:8181/metricsPrometheus can scrape these metrics and drive alerting or the official FireSonic Grafana dashboard.
Official Grafana dashboard Commercial
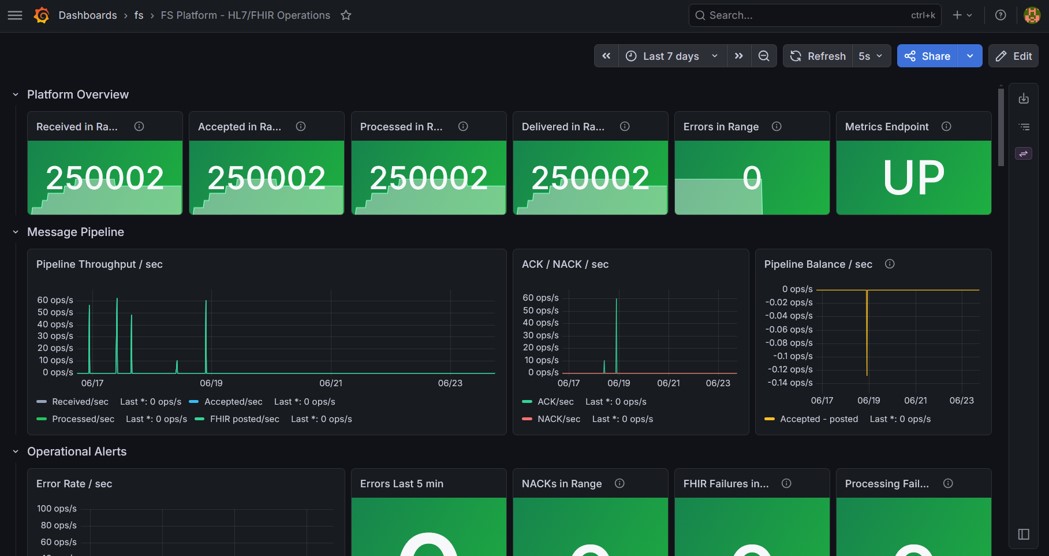
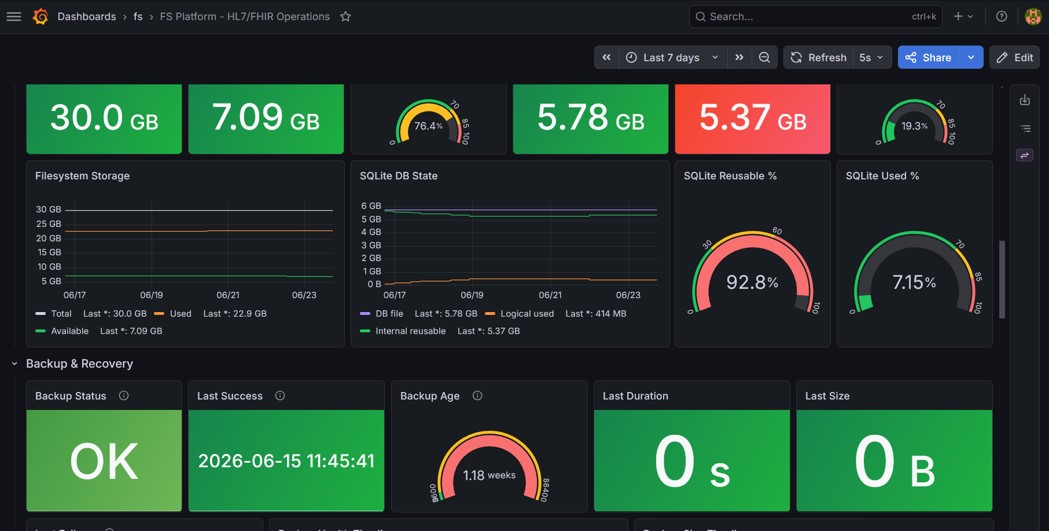
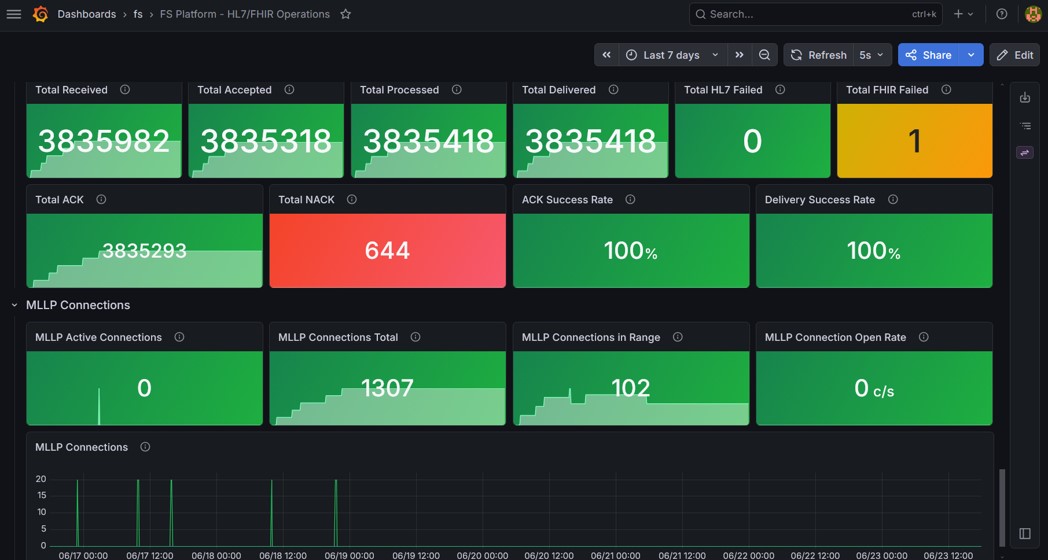
The official dashboard bundle provides a consolidated operational view of throughput, delivery, failures, storage, backup, MLLP connectivity, ACK/NAK behavior, success rates, and runtime health.
Operational monitoring guidance
| Area | What to watch |
|---|---|
| Health checks | Application, database, listener, scripts/rules, processing leases, and downstream availability. |
| Failures | Processing failures, delivery failures, rejected messages, NAKs, and changes in retryable-message counts. |
| Capacity | Received/processed/delivered rates, queue pressure, processing latency, and sustained throughput. |
| Storage | Filesystem free space, SQLite database size, reusable space, retention behavior, and growth trends. |
| Backup | Backup success, age, duration, size, and external-copy state where configured. |
| Runtime | CPU, memory, JVM behavior, and resource recovery after traffic spikes. |
Alert thresholds should reflect the expected traffic profile and infrastructure capacity of the deployment rather than generic fixed values.